


Trump’s Ceiling a Bad Sign for MAGA
Trump's ceiling may be too tough for him to break through.


Hitting 50% in the polls is a critical milestone. Trump can't get there. He's hit a point where too many people just don't like him, trust him, or are too fatigued to go back. This may be the most important metric in all of the polling data to consider. It's far more important than the horse race. I've asked Carl Allen, author of “The Polls Weren’t Wrong” to explain why in this guest column.
In 2016, Donald Trump narrowly won the swing states necessary to become President.
In 2020, Joe Biden did the same.
But comparing these elections apples-to-apples, as most analysts do, betrays an understanding of both what poll data means - AND how forecasting works.
Polls, contrary to what FiveThirtyEight, The American Association for Public Opinion Research, Nate Silver, and the consensus of US analysts claim, are NOT a prediction of the eventual election margin - nor even who will win. (The currently accepted definitions literally state that poll accuracy can be measured by how well they predict the result).
This polls-as-predictions standard is wrong and unscientific, and my book, "The Polls Weren't Wrong" is the first to take on this misinformation (by explaining why it exists in the first place, and proving it wrong), and provide a scientific replacement for how to properly evaluate poll accuracy. And perhaps more importantly in the short term: give non-scientists the tools they need to understand poll data if the field’s authorities continue to misinform.
As I outline very early in the book, before diving deeper into why the polls weren't wrong about the Trump-Clinton election and the UK’s Brexit:
Polls are not a prediction of a future state - they are an estimate of a current one.
Experts and the public alike usually nod their heads here. That "snapshot" mindset, though correct and often regurgitated, is poorly understood.
The people who correctly say "polls are snapshots" are the same ones who take a poll or poll average showing a candidate "ahead" 46% to 40% to mean that - "if the polls are right" - the leading candidate will win by six.
And if they lose, or don't win by exactly six, well, polls must have been wrong. No other possible explanation!
See the disconnect?
They say they understand polls are just snapshots, but then analyze the polls by how well they predict the outcome.

When someone says they understand that this snapshot is...just a snapshot...we are perfectly justified in believing them.
But when they say “This snapshot must have been wrong because the person pictured ahead didn’t eventually win” that should raise a lot of red flags that this person knows what a snapshot is supposed to tell us in the first place. And when they criticize the photographer’s methodology for not producing an accurate snapshot, it gets messy.
Based on simple arithmetic, the field’s consensus calculation for "if the polls are right" makes some big assumptions. One big one is that "undecideds" must split evenly. There are more.
It is said and accepted that a poll or poll average that reports the following:

Can be judged for accuracy by how closely the final result is to this:
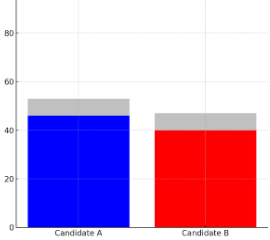
But that assumption that undecideds must split evenly to the major candidates – without even touching on the other assumptions made – is poor, based on no data, and certainly doesn't come from the poll itself. Saying poll accuracy (the snapshot) can be measured by how well they measure something they don't try to (the result) is, to put it nicely, not correct.
Clearly, with 14% undecided, a candidate who is “up by 6” could easily lose – even if the polls aren’t wrong!
Hence: the current calculations are unscientific.
So, why do polls then?!
In slightly technical terms, a poll (and poll average) aims to do one thing: provide an estimate of a simultaneous census.
Which is to say:
If you had asked the entire population of interest (a census) the same question, at the same time the poll was taken, instead of asking a random sample from it, then the result given by that simultaneous census would almost certainly fall within the margin of error of the numbers given by the poll.
A lot of words, it's easier to explain with an example.
Using the "46-40" example:
If I had taken a simultaneous census instead of a poll, then almost certainly: 46 percent plus-or-minus the margin of error of the population will say they currently support. That candidate, 40 percent plus-or-minus the margin of error currently supports that candidate, and so on.
If that definition feels a little...abstract...I'm sorry. But that's the math that underlies the margin of error, and where poll data finds its value.
I introduce this concept of "simultaneous census" in Chapter 7, and it is the scientific replacement for the current unscientific standard, which is "future value."
But, as I promised the publisher, although the book will correct the field's current standards, it is not too technical for even the average consumer of poll data.
If you're not an analyst interested in calculating poll accuracy, you can think of a "simultaneous census" as a base of support.

This representation of a poll or poll average should look to you exactly as the footrace snapshot did.
That is: right now, these candidates currently have the support of approximately this many voters.
Importantly: that "approximate base of support" also applies to voters who are polled as "undecided!"
This snapshot is taken well short of the finish line.
This data says that if instead of poll(s) I had taken a census, 14% plus-or-minus the margin of error, at that time, probably would have stated that they're undecided!
And how undecideds decide is not within the scope of what a poll tries to tell us.
So to answer the question: "Why do polls?"
We do polls because having an approximate "base of support" for each candidate – and an idea of how many voters are undecided – is great data for informing a prediction. But if we're going to do good analysis, we can't confuse data to inform a prediction as a prediction.
With that disclaimer out of the way, let's look at some data.
First, some election data:
In the 2016 election, Trump won PA with 48.2% of the vote.
In 2020, he lost PA with 48.8%.
In 2016, Trump won WI with 47.2% of the vote.
In 2020, he lost WI with 48.8%.
In 2016, Trump won MI with 47.3% of the vote.
In 2020, he lost MI with 47.8%
Wait - if his vote share went up in every state, how did he lose?!
As any mildly informed voter could tell you - 2016 had a relatively high number of third-party voters, and 2020 had far fewer.
And because our elections are determined by "most votes wins"...
Knowing approximately how many people will vote third-party is an indispensable piece of data!
Polls provide a good estimate of that data.
But current standards for analysis say:
46-40 with 6% third party and 10% undecided is "basically the same" as
52-46 with 0% third party and 2% undecided, because both of them are "+6."
We can't compare elections with dissimilar underlying variables without accounting for them. At least, good analysts wouldn’t.
While 2016 was a 21st-century outlier with how many third-party and undecided voters there were in the polls, 2024 is shaping up to be an outlier in the opposite direction: there are very few.
So, if Carl can only teach you one thing today, remember: a candidate's closeness to 50% is much more important than how much they're "up by."
Let's apply that understanding to 2024's poll data, in which candidates will likely need at least 49.5% of votes in swing states in order to win.
Here is Trump's poll average by state, in July versus today.
State: July / Present
PA: 47.9/47.8
WI: 47.1/47.3
MI: 45.5/47.6
AZ: 47.7/48.8
NV: 47.9/47.5
GA: 46.6/48.4
NC: 47.2/48.2
I listed the three "blue wall" states first for a reason. They're Harris' simplest path to the White House, and if she wins them, she's almost certainly won the Electoral College.
Many people get panicked about that poll average jump in Michigan. Two points relative to July, whereas PA and WI were effectively flat.
You shouldn't panic. Remember: vote share.
Going from 45.5 to 47.6 in Michigan, though it's a bigger move, is LESS MEANINGFUL than going from 47.7 to 48.8 in Arizona.
While (if you're rooting for Trump to lose by a lot) you'd certainly rather his numbers be lower everywhere, the reality is, Trump has a very loyal base. We should expect Trump's poll numbers to increase from 45.5 in states where he pulled nearly 48% of the vote in 2020.
Remember: when people say "Trump outperformed his polls in 2016 and 2020" that's because they're operating under the flawed "polls-as-predictions" mindset instead of the proper "polls as base of support" one.
In 2016, his poll numbers were in the low-to-mid 40s with lots of undecideds in the swing states, and he finished around 47% or 48%, with third parties pulling several percent.
A lot of "wish we had a different candidate Conservatives" were hiding out as "undecided" and came home.
In 2020, his poll numbers were higher than in 2016, in the mid-40s, with fewer undecideds, and in most swing states, he ended up still getting around 48% to 49% in the election. Third parties pulled very few votes in this one.
But that 48%-49% was not enough to win in 2020.
In July 2024, when Biden was still in the race, polls showed undecideds well into the double digits, with Biden's numbers in the low-to-mid 40s. That is, Trump was "up by" about four points in most swing states.
Some forecasters took that as proof that Trump should be favored. After all, he was "ahead!"
I wasn't convinced. The assumption that "undecideds" are homogeneous, and/or that they're most likely to split evenly, is lazy at best.
Most of those "don't know" voters were very easy to classify: lean-D voters who had previously voted for Biden and stated that they supported Dems in Senate races, but wanted a different candidate, so wouldn't explicitly state their support for Biden.
If Biden had remained the candidate, would they have "come home?" A reasonable debate. But we don't need to debate it anymore.
Biden is no longer the candidate, and Harris quickly consolidated those lean Ds hiding as "undecided."
Now, with "don't knows" hovering around 3%-5%, Trump hasn't improved his position much anywhere.
In my forecast, Harris is doing basically what I forecasted back in August, pushing her number closer to 49 in the blue wall, and 48 elsewhere: that's why my forecast has stayed pretty consistent, relative to others.

Other than maybe Arizona, where Trump's poll average is 48.8% according to my methodology (though slightly lower in others) he hasn't pushed his poll average to an unexpected number.
In an election where both candidates are likely to get AT LEAST 48% of the vote in the swing states, given very few undecideds, we should expect poll data to reflect that.
One extremely valuable lesson in "The Polls Weren't Wrong" is that if you're interested in using polls to INFORM a prediction, being "ahead" 49-47 is far preferable to being "ahead" 46-40, all else equal.
While 49-47 feels "close" - because it's unlikely to result in a blowout - the win probability of a candidate in that position is extremely high. Higher than I expected, and higher than almost anyone would believe, if not for the piles of data I provide to support it.
And in addition to the observation, I go as far as to explain how and why!
Reasonable people would expect states like Arizona and Georgia to be close, regardless of who wins. Neither candidate reached 50% in those states in 2020, and they were decided by tenths of a percent.
But Trump hitting these 48 ceilings in the blue wall states, where he got 48.8, 48.7, and 47.8 in 2020 is...exactly what you'd expect if Harris were favored.
It sounds almost childish to argue with forecasters in this way, but when I ask:
Which candidate is more likely to get to 50% in Pennsylvania?
Even if the poll averages were “tied” at 48-48, or Harris narrowly “ahead” at 49-48, the answer doesn't always fit neatly under a bell curve. Given a poll average of 48-48, it's not always equally likely that either candidate could hit 50%!
And therein is a big difference between polls and forecasts, which my approach appropriately accounts for and others don't:
Polls, as a tool, are designed to give us an approximation of a candidate's FLOOR. They aren't designed to estimate their ceiling!
That's what we need a forecast for. To use a recent example:
In the 2022 Ohio Senate race, Tim Ryan's polling average on this date in October was around 46%. JD Vance's, a name you might know, was around 45%. But good forecasters understand that not all undecideds are equal. While it was certainly possible Ryan could win, if he wins, it would probably be very narrowly, with 51% being the high end.
But no one should be surprised if Vance ended up at, say, 54% (he ended up with 53%).
In other words, a good forecaster would note that their ceilings are very different because not all undecideds are equally likely to support each candidate.
And that despite the poll averages showing Ryan "ahead" that does not necessarily mean he should be considered "favored."
In most elections, finding an approximate floor comes from poll data, while finding an approximate ceiling is more challenging: it has more moving parts that are harder to quantify.
Fortunately for us nerds, Trump has run in two elections, which is far more data than we typically have for Presidential races. That's good data.
And, unlike Nate Silver who wants to intimidate all pollsters into asking the same questions in the same way, I strongly support Monmouth University Polling and Director Patrick Murray providing a different angle:
In addition to asking registered voters who they'll "definitely" or "probably" vote for, they also ask who they'll "definitely/probably NOT" vote for.
That doesn't fit neatly into Nate's volatile model which apparently can't do anything more than update poll averages, but it does provide good forecasters with valuable data:
When 50% of registered voters say "definitely/probably not Harris"
And 53% of registered voters say "definitely/probably not Trump"
That provides more support for the already strongly-supported hypothesis that Trump will have a very hard time winning an election without a third-party presence lowering the percentage of votes needed to win, as in 2016.
In order to win, in every swing state, candidates will likely need at least 49.5% of votes.
That's not to say Trump can't get there. If Harris voters don't turn out in powerful numbers, or Trump has somehow found some more voters (and not alienated an even greater number) yes, it could happen. Trump has a very, very high floor.
But the Trump ceiling is real, and that's why the "tossup" mentality is misplaced in this election.
When Trump outperformed his poll averages in 2016, he was polling in the low-40s, and finished around 48%; that was enough to win.
When Trump outperformed his poll averages in 2020, he was polling in the mid-40s and finished around 48%-49%. Due to lower third-party turnout, that was not enough to win.
Now that Trump’s poll average is already much closer to 48%, some are assuming that he’ll again outperform his polls. But outperforming a poll average of 42% (2016) or 45% (2020) is very different from outperforming one of 48%.
Third-party turnout will likely be very low in 2024.
If you believe my forecast, Harris winning PA by 3 is more likely than Trump winning it by 1. But I can't understate the reality that Trump could win it by 1, so we have to sprint through the finish line.
You can find Carl Allen (@RealCarlAllen) on various social media, and his analysis here on Substack.
 | A guest post by
|
This is an awesome breakdown. Thank you. To me it says that if we in the Harris camp keep the pedal to the metal all the way to election day then we will likely win, even if the numbers are close! Let’s keep pushing forward and reaching those voters folks. Write postcards, knock doors, phone bank, and bring three people with you to vote for Harris!
Every now and then one comes across a perspective that is such an original way of looking at things that it seems counterintuitive at first. But once someone explains it clearly, it seems so obviously valid that you wonder why anyone ever looked at it the old murky, unreliable way.
Thank you, Mike and Carl, for your crystal clear explanations of polling, which are making me feel like a genius (for a few hours, at least). 🙏